
What Your Contribution Margins of the Last Five Years Reveal
“Revenue has grown by a quarter over the last five years, and the order books are full.” Many conversations with managing directors begin like this. The next question is: And how have the contribution margins developed – by product group, over the same five years? That is often when the room goes quiet. Not because the answer is bad, but because nobody knows it.
We ask this question in every first conversation. Because hardly any other metric tells you as early and as honestly whether a company is still on course.
Why revenue and annual results warn too late
Revenue measures volume and price, but not whether the business pays off. Growth can be bought – with discounts, with low-margin projects, with merchandise. The annual result, in turn, is the sum of everything: operating performance, one-off effects, depreciation, non-recurring costs. It shows that something has happened, but not what and not where.
The contribution margin sits in between. It shows what remains after deducting variable costs – materials, external services and other volume-dependent costs – to cover fixed costs and generate profit. And it can be measured where decisions are made: by product group, by customer, by sales channel.
Why five years?
A single year is a snapshot. Raw material prices, a large order, a currency effect – all of these distort the picture. Five years reveal the underlying trend. And the last five years have been a stress test: disrupted supply chains, a wave of price increases in materials, energy and wages, plus tariffs and currency shifts. Anyone who held their contribution margins over this period has proven pricing power. Anyone who lost them should know why.
Four patterns we see again and again
If you line up contribution margins by product group over five years, four typical patterns emerge in practice. Each tells a different story – and calls for a different response.
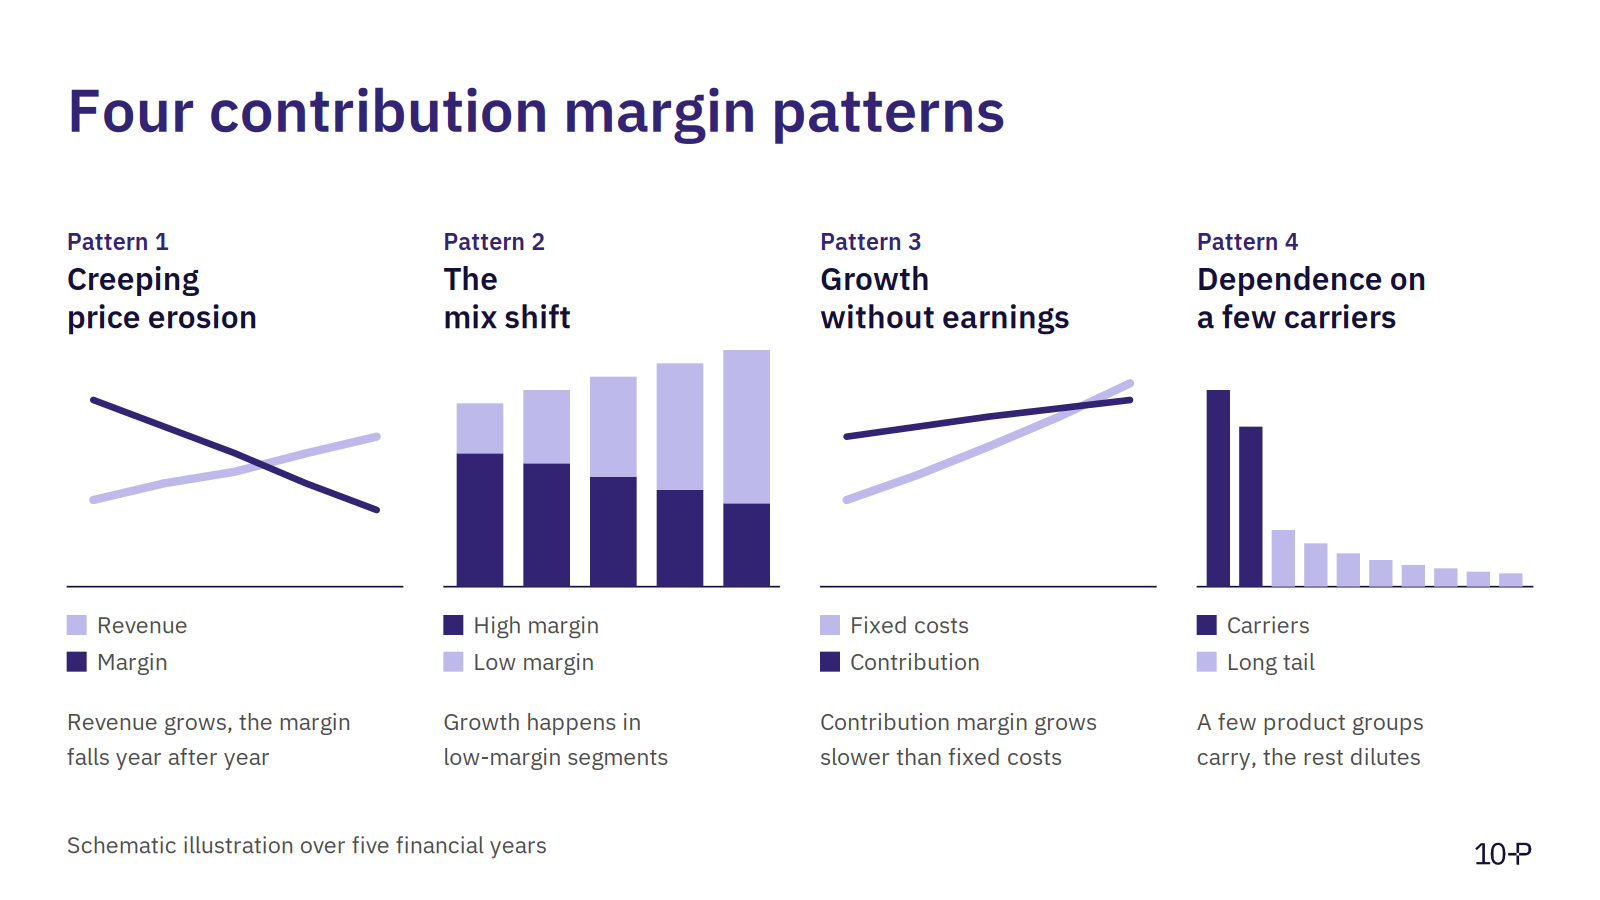
1. Creeping price erosion. Revenue holds steady or grows, while the contribution margin ratio falls by half a percentage point or a full point year after year. Individually this hardly stands out; accumulated over five years it is a different earnings situation. The causes: cost increases that were not passed on, growing discounts and special terms, a price-performance ratio that has shifted in favor of the competition. This finding belongs on the agenda of sales and product management – not accounting.
2. The mix shift. Each product group is stable on its own, and yet the company’s contribution margin ratio falls. The reason: growth is happening in the low-margin segments – merchandise, project business or a key account with special prices. This pattern only becomes visible when broken down by product group; in the overall view it stays hidden.
3. Growth without earnings. Contribution margins rise in absolute terms, but more slowly than fixed costs. Personnel, overhead and IT grow along with them, sometimes faster. Every year the contribution margin covers a smaller share of structural costs. A good early indicator is personnel productivity: gross profit relative to personnel costs.
4. Dependence on a few carriers. A few product groups earn the money, a long tail dilutes it. As long as the carriers perform, nobody notices. When patent protection ends, a competitor arrives with the better product or a key account walks away, the foundation collapses. This is exactly what happened to the power tool manufacturer in our turnaround case study: a single product carried the company for over 30 years – until patent protection expired.
And there is also the encouraging pattern: contribution margins that remain stable or grow despite rising costs. That is proof of a clear positioning and genuine pricing power.
What the patterns say about the state of your company
The development of contribution margins is one of the most reliable indicators of which of the four states a company is in. Stable or growing contribution margins despite rising costs point to transformation or a healthy optimization. Creeping erosion and mix shift are typical signals of the transition from optimization to restructuring – often long before the annual result turns red. When contribution margins no longer cover fixed costs and revenue is falling on top of that, a turnaround situation is not far off.
When the question cannot be answered
In many mid-sized companies, the contribution margin exists only as the gross profit of the company as a whole. There is no cost unit accounting, post-calculations are not carried out systematically, and the allocation of costs to product groups is disputed. That is a finding in itself – and a serious one: anyone who does not know what they earn money with can neither justify prices nor steer the product range nor delegate responsibility for results.
That is why, at a global component manufacturer, the turnaround did not start with a list of measures but with end-to-end cost unit accounting and monthly tracking of revenue and margin across more than 60 management groups (see the case study). Only this transparency revealed what the company was earning money with – and what not.
Recommendations
- Reconstruct five years. Draw up contribution margins by product group for the last five financial years – better rough and complete than precise and full of gaps. A defensible allocation key beats a perfect one that is never finished.
- Break down the change. Split every change into price, volume, mix and cost effects. Only then does it become clear which pattern is at work and who holds the lever.
- Assign responsibility. Name one person for each product group who is responsible for its contribution margin – with the necessary decision-making authority over prices and terms. That is the core of the entrepreneur within the company.
- Steer monthly instead of stating annually. Contribution margins belong in management’s monthly reporting – as a management tool, not as a control figure in the annual accounts.
The question about the contribution margins of the last five years takes ten seconds to ask. The honest answer is often the beginning of a fundamental assessment of where the company stands.
Would you like to know what your contribution margins say about your company? In a no-obligation 30-minute conversation, we jointly assess where your company stands and which fields of action offer the greatest leverage. Book a conversation.
Further articles:
The Four States of a Company: Where Does Yours Stand? (link)
Restructuring Case Study: Turnaround of a Global Component Manufacturer (link)
Peak Performance through Transparency (Part 1 / 2) (link)
Entrepreneurs within the Company (link)
Where does your company stand?
The Corporate Health Check quickly shows where your company stands and which levers have the greatest impact. Let's get to know each other in a no-obligation conversation.
Request a meeting

