
Peak Performance through Transparency (Part 1 / 2)
Let us turn back the clock a few years and remember how error-prone planning a road trip by car could be. The road map offered a first indication of the route, but the approximate duration of the journey had to be estimated based on one's own experience. The fastest route out of several options had to be identified on your own, while information about roadworks, detours, or traffic jams was only partially available via the radio.
Navigating during the drive required a keen sense of orientation – which for some travelers could lead to significant detours. Under these conditions, planning fuel stops or efficient charging sessions along the route would have been unthinkable.
Today – in the age of the internet, smartphones, and artificial intelligence – planning a trip is done in a matter of seconds. The accuracy of the predicted arrival time is many times higher than in the years of analog travel planning.
What does this mean for corporate management?
While the availability of real-time data and the connectivity of end devices enable a reliable forecast of the expected course of the journey, most small and medium-sized companies in particular are steered on the basis of data that is the equivalent of the road atlas: the balance sheet, income statement, and cash flow analyses each show a historical snapshot of business performance. A data-based forecast of the future course of business cannot be derived from them, and the path to the next monthly, quarterly, or annual close resembles flying blind.
This applies not only to classic financial figures, which are influenced by numerous operational levers. The availability of relevant operational metrics in real time is often also lacking for steering the organization in day-to-day business.
Looking ahead with operational metrics
As shown in the travel example, it is decisive for the sustainable success and targeted steering of a company to continuously evaluate operational performance indicators in order to determine the "estimated time of arrival" as realistically as possible.
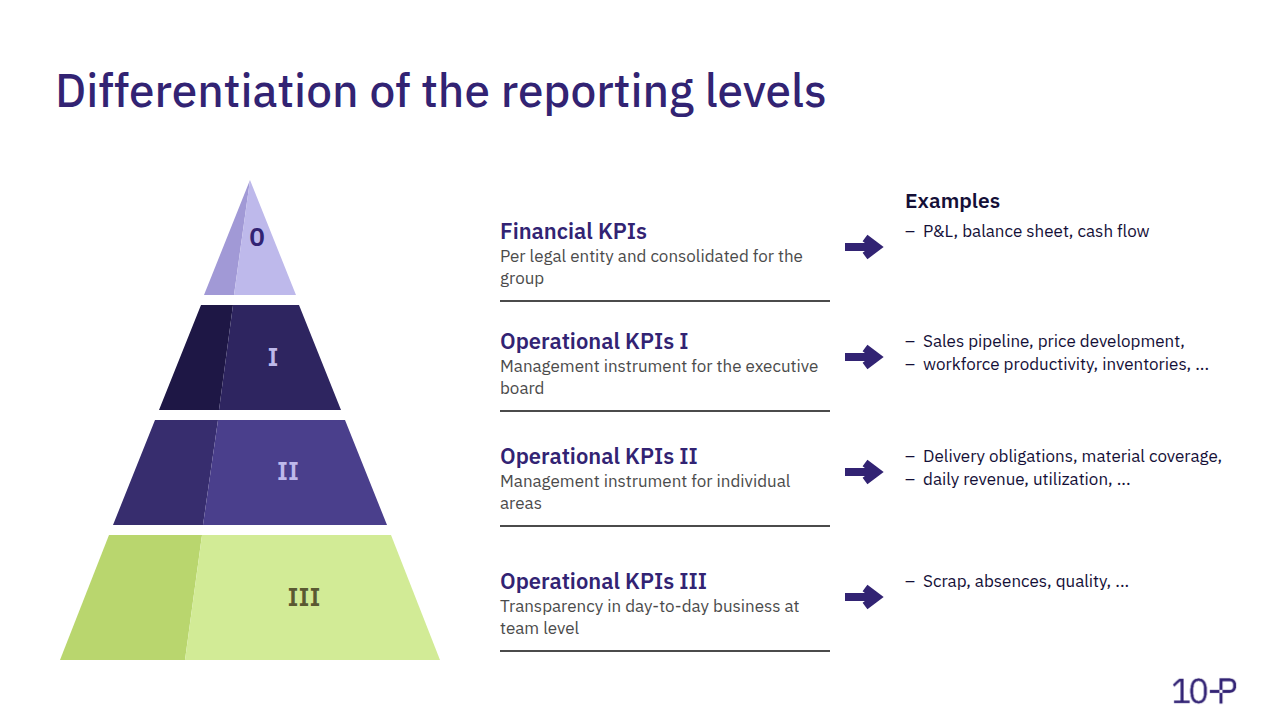
A four-level differentiation of metrics has proven effective here:
- Financial KPIs: The balance sheet, P&L, and cash flow provide retrospective evidence of the economic success of the previous period.
- Value-driver metrics: Sales and purchasing price indices, the development of the sales pipeline, or personnel productivity in relation to gross profit have a direct effect on financial performance.
- Process metrics: Order intake, material availability, delivery commitments, order backlogs, and delivery reliability allow precise steering along the value chain.
- Productivity metrics: This is about the ability to evaluate the performance of individual teams or employees in real time – e.g., via system data such as the age of purchase requisitions or the number of picks per hour in logistics.
With a well-thought-out structure of these metrics, transparency increases across all performance processes. The result is a leadership instrument that contributes to the development of a sustainably dynamic organization.
A deliberately chosen measurement frequency and a functioning reporting structure are decisive for the information gained to actually take effect in the organization.
Introducing metrics transparency
Developing and establishing a functioning metrics structure poses particular challenges, especially for small and medium-sized companies. Lack of data availability, insufficient discipline in using the ERP system, inadequate master data quality, uncertainty in handling analysis tools, or resistance to this new form of transparency are among the typical hurdles.
A step-by-step approach is therefore recommended: start with a clearly defined, small set of metrics that can be adapted, expanded, and optimized over time.
In the best case, this develops a momentum of its own – employees identify weak points, initiate improvements, and contribute their own ideas for optimizing the metrics structure. What is decisive here is that transparency is understood as a support, not as an instrument of control.
Recommendations for increasing transparency
A frequently underestimated success factor is the consistent implementation and use of an ERP system. Only when master data is consistently maintained and processes are cleanly aligned does a realistic, trustworthy picture of the company's reality emerge.
Equally important is involving employees early on – not only to secure acceptance, but above all to obtain as precise a picture of operational workflows as possible. The detailed knowledge required for this is often anchored in the minds of individual employees.
In this context, process thinking plays a central role: only when metrics are implemented along the actual performance processes does sustainable benefit arise. An aligned process architecture – particularly in sales and production – offers a suitable starting point for an effective metrics structure.
Conclusion: Transparency is the key to steerability
A coherent, structured, and relevant metrics landscape is far more than a reporting tool – it is the foundation for forward-looking steering, rapid response, a dynamic organization, and operational excellence.
For companies in the Mittelstand, transparency through operational metrics does not mean control, but a tool for achieving true peak performance.
Further articles:
Peak Performance through Transparency – Part 2 / 2 (Link)
The Leadership Control Loop (Link)
Restructuring: Turning Problems into Opportunities (Link)
Where does your company stand?
The Corporate Health Check quickly shows where your company stands and which levers have the greatest impact. Let's get to know each other in a no-obligation conversation.
Request a meeting

